Sketchup, BIM and return on investment

Yes, that makes sense and it is a trend that has been going on for a decade now: to duplicate as much external info into the model, so that you are sure that the BIM model is the only and complete source of truth. The issue with that is that external data will always have its source externally and that duplicating it will be troublesome to keep in sync.

Power BI can link to all these native data sources, keep them in sync with a single click and allows you to use them.

This is perfectly doable with 3DBI without bringing the data to SketchUp, but by having a matching Id between the door in SketchUp and the information about the door in your Excel sheet. (or other maintenance tool/webservice). With a little setup in Power BI you can then make it in such a way that clicking the door in 3DBI will filter a table automatically in which you visualize maintenance data, for example.

Here is an article in which I attempt to explain that idea: Real Time Building Information : visualisation des données de maquettes numériques avec Power BI - Articles - HEXABIM

Or, here is another article I found on the web, only after I created 3DBI, but that is inline with what I try to solve with it (and RTBI, but that is not available for SketchUp yet): https://www.bdcnetwork.com/bim-bim-data-without-models

1 Like

I would like to elaborate a bit more on this dataflow. The following movie will show a dashboard of a warehouse. Instead of doors in a building here I show pallets in a warehouse, but the idea is the same. In the source SketchUp model I have assigned a unique id per pallet location. I also have an excel sheet with the actual data of each pallet (or door in your case). By tying them together in Power BI, you can filter elements in the SketchUp (well, 3DBI) model based on any data you have. In the movie you will also see that I can click on a pallet location (or, again, in your case this would be a door) and see the other visuals immediately filter to only show data that is related to the selected object.

The 3DBI visual acts like any other visual in Power BI: selecting something in one visual (chart, table, slicer,…) immediately alters all other visuals to only show data that is related to the selection you made:

2 Likes

Ok great thanks for this.

I’m a little pressed for time at the moment to get other things done, but I will look into your videos in greater detail another time.

But in short, am I correct in saying that if the ID in the Sketchup is consistent with the ID in the excel / database, then all info should sync correctly?

For example, you could have any amount of information in the database (maintenance, products, type, IFC, unique company codes, tags etc), and as long as that ID is linked, then you can use your software in conjunction with the database to then filter info, which will then ‘call’ that object in the sketchup file which will then allow you to see that product!?

If I am correct, to get this set up, you have to go into sketchup, assign a completely unique ID to each object, and then that should be enough to then correlate to the same info in the database. You can then set up your database / Power BI how you wish in order to filter things easily according to that dashboard / workflow / stakeholder.

If you choose to add more column / data to the database (e.g. new certification information on a product / updated maintenance etc), then this will push that into sketchup accordingly. This all correct?

1 Like

Yes, except: it will not push data to SketchUp. Everything happens in Power BI. SketchUp is used to draw the geometry and assign a unique id to your business objects and then you export that geometry (+ all existing sketchup data if you would want) and bring it into Power BI together with all other external data you have. As long as that unique ID in the SketchUp model (and resulting 3dbi model) matches with the other data you have you can use any of this other data to colorize and filter elements in the 3DBI model (that is coming from your SketchUp model).

2 Likes

Ok perfect thanks.

Whilst I like the function of many other services (viewpoint etc), whilst not perfect, I think it’s safe to say that Microsoft products will be around for a while. Also there are a number of devs which can work on the databases to help you get what you want.

We (the company I work for) are still far away from making descisions about what system to use, and excel will probably used for at least another 6 months, but it’s great to know that in essence, Sketchup can plug into Microsoft products to visualise information via Microsoft BI.

That in itself, makes Sketchup a powerful tool for decision makers in businesses as it gives them clarity on the state of their building. This can (as you have mentioned) be linked to product costings / maintenance costings etc which provides useful insights into the project. This could once again link back to the Level 3 BIM and allow smaller (ish) companies to then compete.

That being said, if Gov / Company go with X BIM solution, then I guess other people will have to shift accordingly!? I have no idea how big management companies are going to work, as they may have to simply work with 5 different systems!? From what I undestand it is still a little unclear who manages the date (client vs agency vs subcontractor or ALL).

This is why I like the idea of a Microsoft products, as they don’t just do BIM, they do many other services which people are already using. Also API and other integration with other software could be more flexible, therefore it can work across the company, not just for say building management.

In my mind, there is something quite refreshing about keeping all the databases to one side, and the 3D on another. Blending the two is only going to create compatibility issues, hence I guess the push for common data environments.

2 Likes

Dear Developers

One more thing i regards to the IFC in SketchUp.

having to the one extra click to see the values in the IFC Attributes from the “Options” is really annoying and so easy to fix…

regards
Simon

Therefore, it would be interesting to see any short YOU-TUBE VIDEOS (by the-only-Aaron) to get the gist of how SU-Pro handles BIM.
Right. I’m waiting.

Hi @kengey and thanks to @MikeWayzovski for pushing forward all the info he always does about Sketchup and BIM. It’s always very insightful.

I’d like to pose some questions to @kengey if this 3DBI is able to keep up with changes to the model and track, for instance, the changes in the design of elements, and update the data and 3D model being shown during the development of the project.

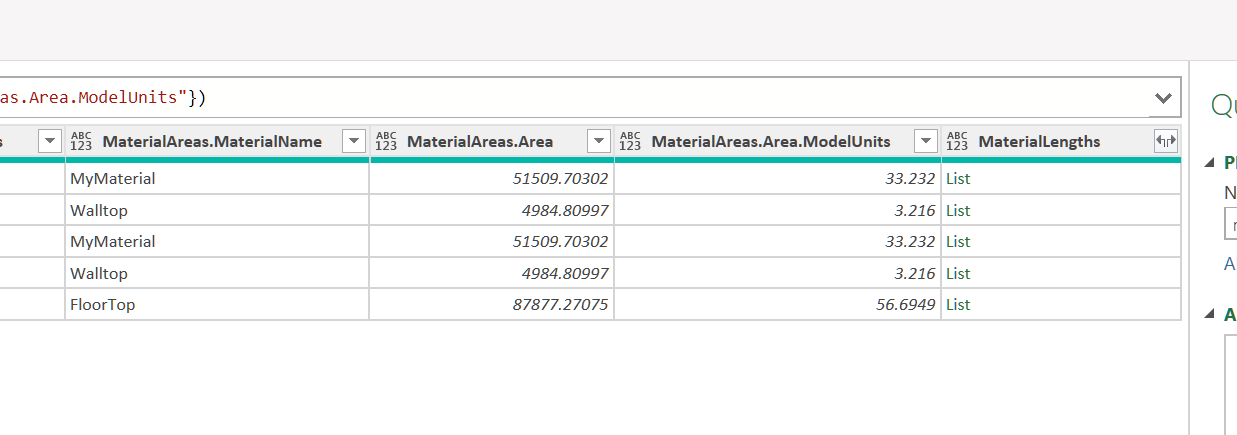
I really like how data is being displayed in Microsoft BI but What I’m concerned is also about standard output. So I’d also like to know if this could be used to create static surveys for quantity take offs, organized by types, like walls, ceilings, floors, and unique object like cabinets, kitchen, sinks, and so on as well as if it could create area reports, gross floor areas, per room, per floor, per building and such info.

I’d like to have a method that would keep up with building design and be able to extract all the info I need from the model, at any time, in an organized fashion, but also a way to infer data that can’t be modeled as it would be too cumbersome.

Specififally I’d like to know if this requires special model organization and detail to work well. I understand that a column or a slab, can be represented by a solid object, however, a layered wall or finishes to the slab, are too complex to be fully modeled.

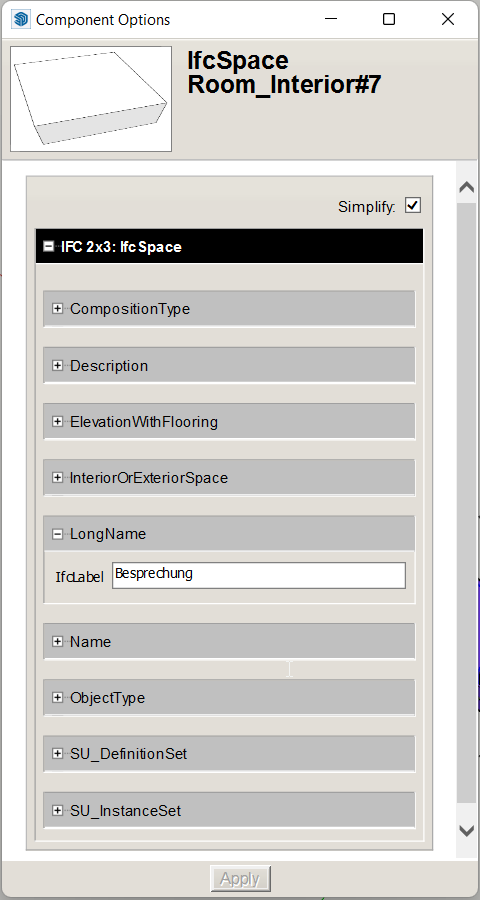
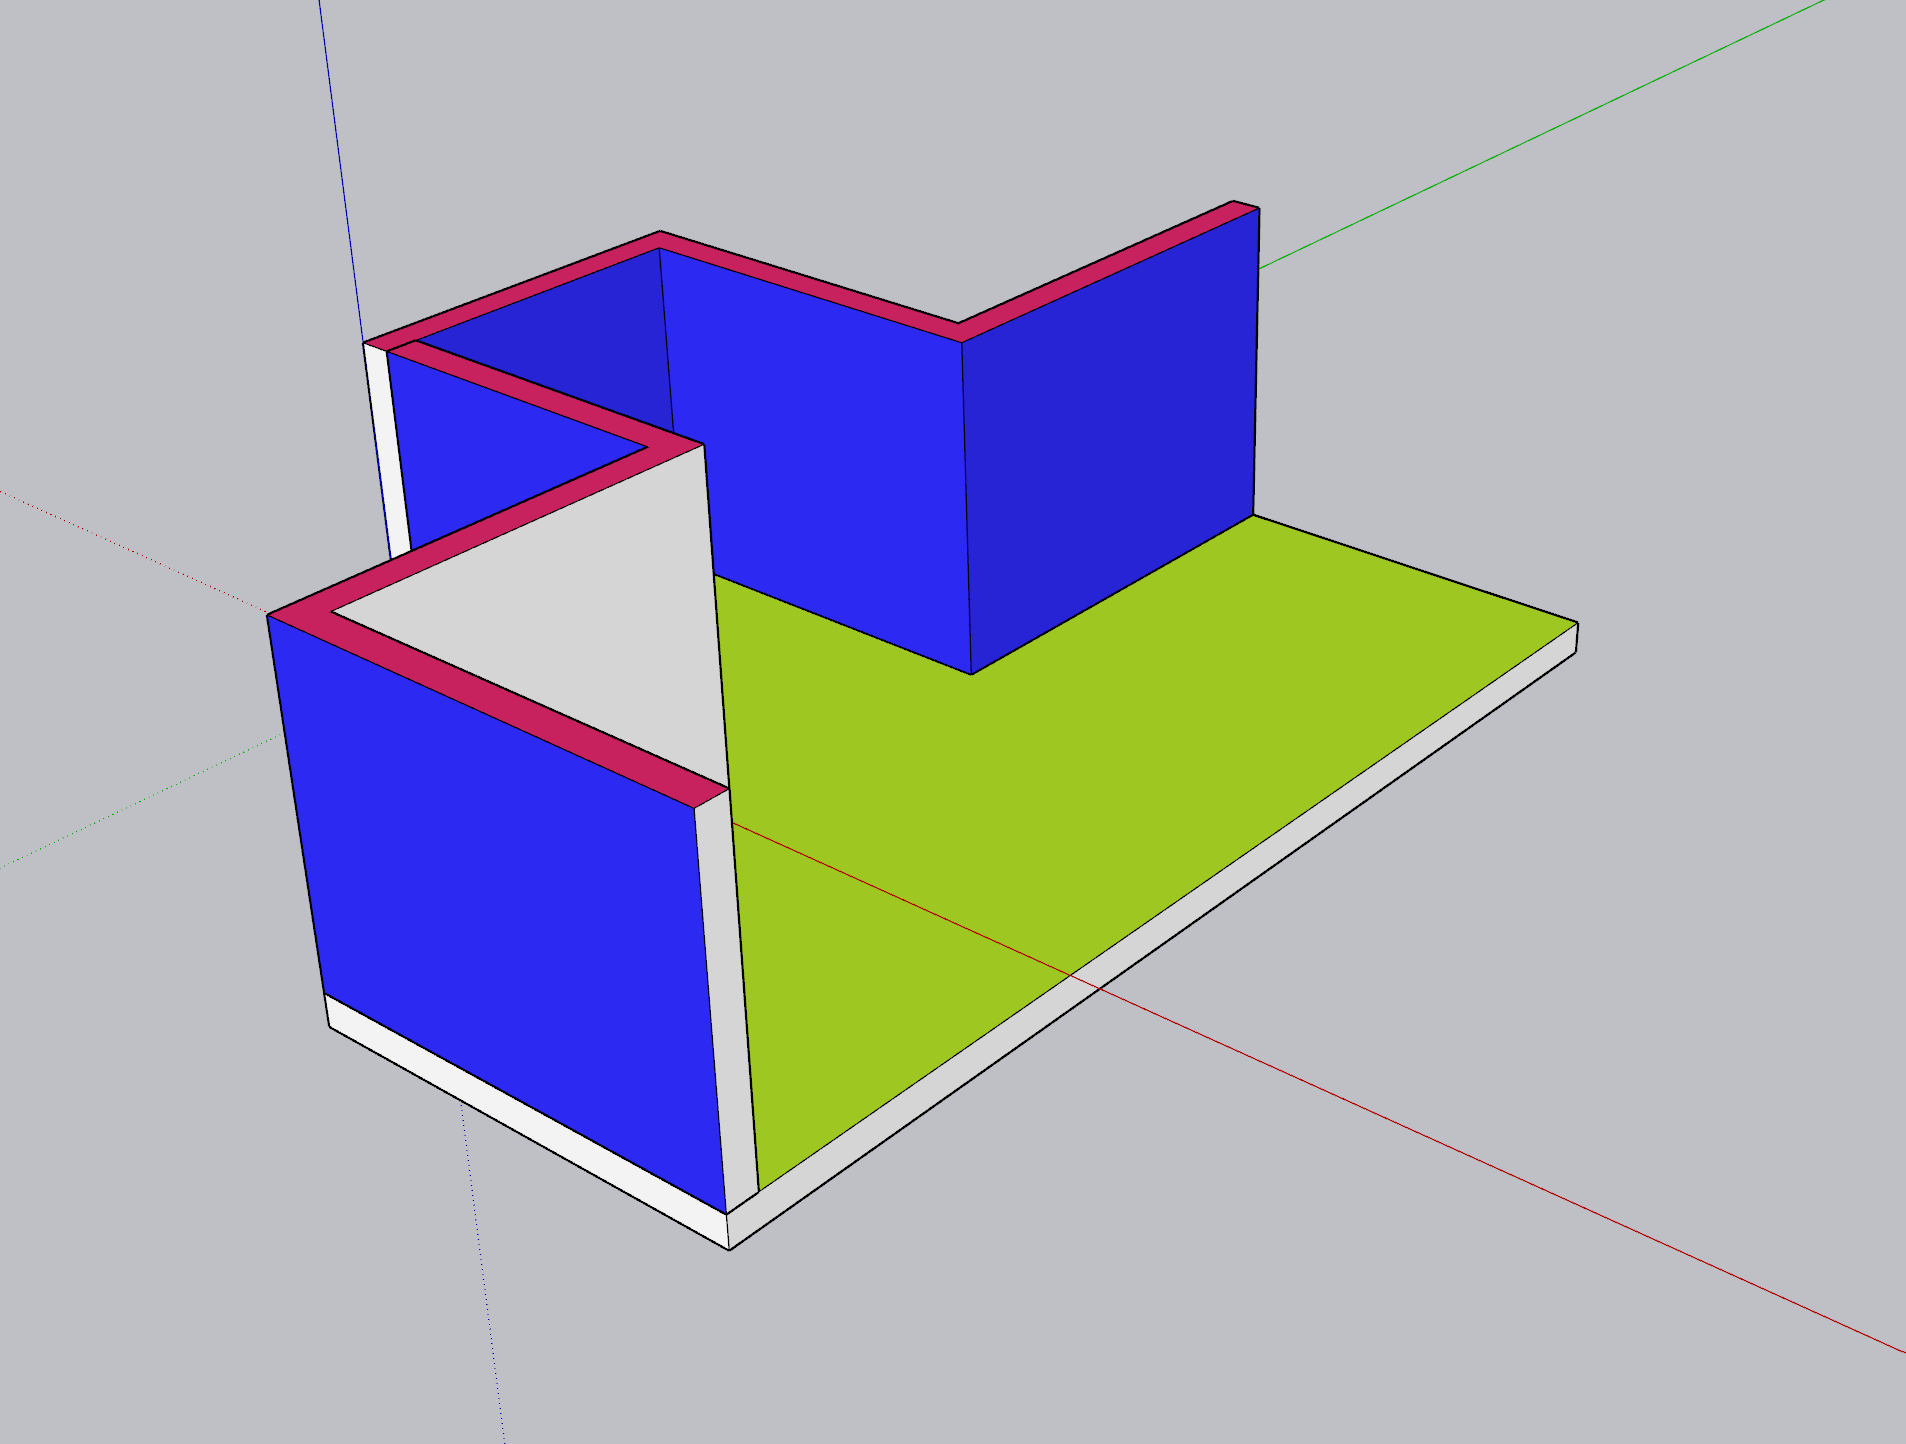
How can we organize the model to represent all the layers of a roof, or wall, or floor, without having to model them?

Is this possible with this extension and, if so, how can we inform Sketchup and 3DBI about that?

Example:

A slab would be represented by a single solid volume. If it’s plain concrete this volume as a direct relation to the report and price. If it’s multilayered, with insulation, waterprofing, roof tiles and whatnot, ideally it is still a simple solid in sketchup that represents all of these layers. The volume of this model, cannot represent that and modelling all layers will make the model impossible to handle. How to solve this with 3DBI?

It would also be important that, each time I would have the work of inputing the info I’d need, I wouldn’t have to redo that work later on, and somehow it would be flexible enough to keep adapting to the added level of detail of following stages. This detail could be due to added detail of the model, but also added layers to the description of it’s element, description that would each have to be accounted for and assigned to costs.

Example: if we need an extra coat layer on a wall, we would ideally add it to that wall, and multiply the wall area by the coat cost. This new info on the wall composition can’t be modelled or shouldn’t be modeled, however it should be added to cost.

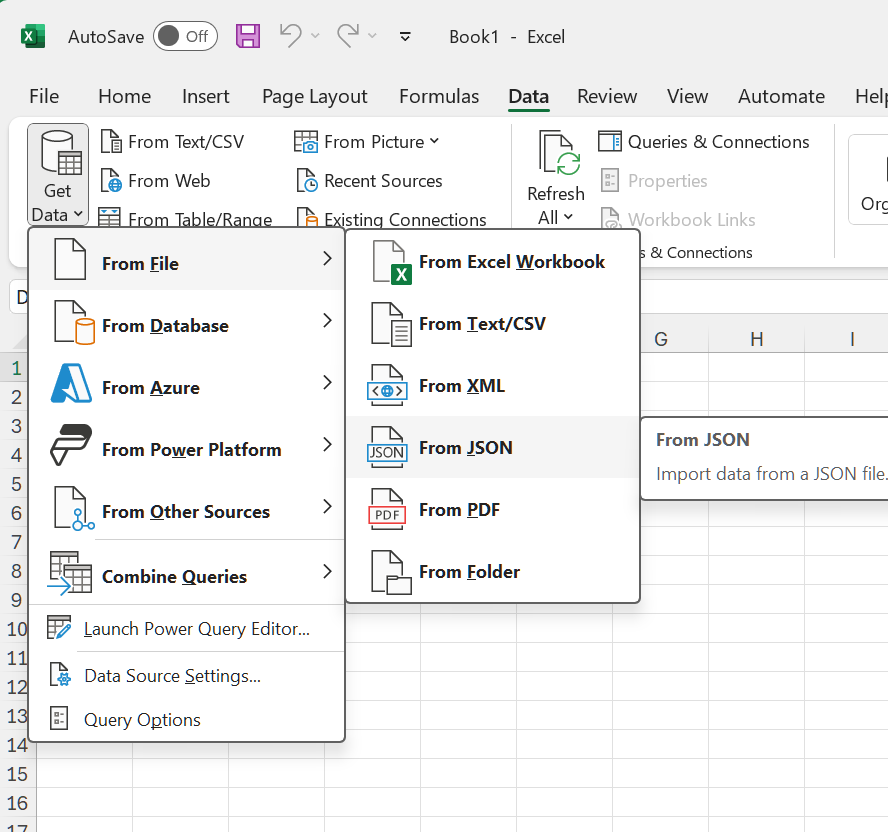
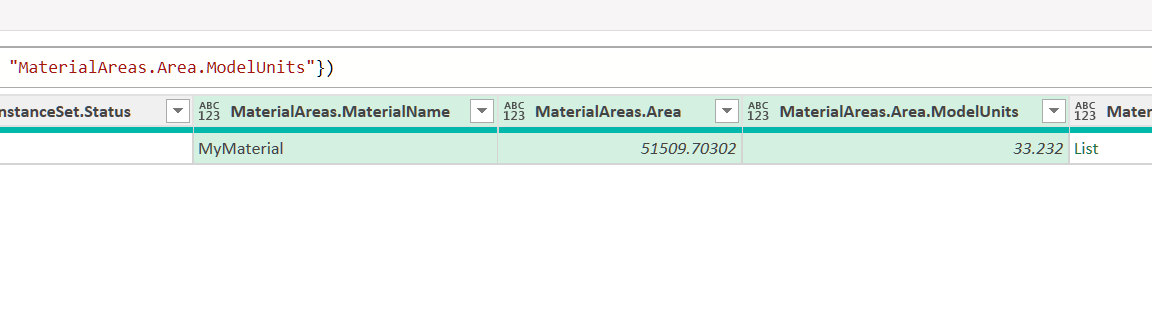
So, for this to be useful for us, it shouldn’t be limited to a new way of showing data (which is very interesting), but would need to be able to create standard take offs in excel and be very flexible in how it measures/reports items from the model and would need allow us to keep adding info, as the design progresses, without loosing previous info, but it would also need to be very flexible and accurate on how it reports volumes, areas, lenghts and take into account how and what each element of the model represents.

I hope the questions being raised here are not too confusing, but I really hope they can be answered by your plugin.

Thanks in advance,

João

I’ve just seen that this is an old post. Quite new to me. Sorry!

I use a Bim5D software called Mamba that can extract the data you need from an Ifc file.
I make my quantity take of with it.
This is my workflow https://youtu.be/1qIGy5GLl88?si=JuOoHP9JkEIiON3E
I hope you can use subtitles to your language…

Thanks! I can perfectly understand you, as I’m portuguese. I will try viewing it tomorrow.

1 Like

Muy buen video, la verdad a mi también me da dolor de panza solo pensar el verme forzado a trabajar con Autocad, al igual que tú, no he utilizado Autocad hace más de diez años.
Muy interesante la metodología de trabajo con Sketchup y Mamba, yo nunca he utilizado Mamba pero para generar los mismos reportes con medidas, cantidades y precios utilizó el plugin Quantifier Pro de mindsight studios.

1 Like

Quantifier Pro lo estuve probando pero no me permite usar las bases de datos que se utilizan en España ni confeccionar el presupuesto tal y como se adjunta a los proyectos. Mamba te permite personalizar unas reglas que te desglosan todas las partidas que necesites, estén o no estén modeladas y arrastrar directamente una partida desde una base de precios web con su descomposición de precio y su descripción para añadir medidas del modelo. Es un paso más allá de la cuantificación pura y dura.

2 Likes

Hi Francisco,

I’ve also been studying how to use Quantifier Pro, but I still feel it is awkward sometimes. I’m still studying how to better use it and better adapt it to my workflow (or rather how to adapt my workflow to it) but I’m reaching a lot of dead ends.

The way it deals with walls that are not flat is only possible if we use Profile Builder. We use profile builder for some aspects of our projects, but it’s usually much more difficult to use it for walls than the Sketchup standard modeling tools. However, if we go for Sketchup’s direct modeling we cannot measure without having each wall type in a different tag and all walls as flat groups. That makes our modeling become unnatural and our tag management even more complex than what it already is. I mean, for Sketchup management and sending to a stacked Layout workflow, the amount of tags is already huge, if we add the tags from engineering and consultants the amount of tags becomes crazy. If we have to set tags for wall types so that each type can have a different price, our tag management is unbearable.

Also, materials are indiscriminate of the base they are applied to. Imagine the cost of painting a wall and a ceiling. It’s true that it might be the same paint, however the man hours and labour involved in painting the ceiling is higher, so the cost is different. With Quantifier Pro there’s no way of assigning a different cost to the same material if it’s applied to different objects and requires a different application method or implies a different cost. The only way we have to control this is to have two similar materials in the model, one for ceilings and the other for walls. This is very prone for causing erros in our models, as once we apply materials, we do it visually and we might confuse the two similar materials.

Also, we have to be very careful to never apply materials to groups or components, by mistake, instead of applying materials directly to faces, as if you paint an object you will paint all it’s faces and this might result in way more material area than it should. It’s dangerous and it implies a care while modeling that is not compatible with the way sketchup is intuitively used. These mistakes happen too often by clicking on a face inside the wrong context, or clicking by mistake on the model somewhere with the bucket tool. The worst is that most of these mistakes are usually hidden from view, so they are not easily found and fixed.

There’s also no easy way of telling that some objects like mouldings, mirrors, cabinets and other construction elements are in front of walls or ceilings. If you want to be accurate with your materials area, you have to limit the area being painted to the actual area where the material exists. This means that, in example, a wall that has a mirror, can’t be fully painted with tiles material, as that will cause the area behind the mirror to be calculated as if it would have tiles, when it shouldn’t. We can edit a wall’s face and draw where the material should stop, we can even use intersect faces to help us, some times, but the amount of work that is required to achieve that is simply not realistic.

Finally, quantifying objects like doors, windows, cabinets and closets or other such elements, is not really that streamlined either. We have to select them one by one, and manually attribute prices to each, as there isn’t a calculation method that seems to be fit for dealing with them.

So, what I feel, is that relying in Quantifier Pro requires you to be really too accurate in the way you model stuff, you paint stuff and you assign object prices, so it implies spending a lot of additional time modeling double checking your model and change it, in order to get quantity take offs and prices to be accurate.

I’m still not sure it pays off.

I’d really love if you could share some kind of workflow on how you do things or if you’ve thought about better methods to avoid this kind of problems, because, the way I see it, they’re only easy to solve on very simple projects. Otherwise we must rely in different software, or in our old manual measuring of the project vs automated methods.

I’ll take a look at @rtches video. I’m hoping it helps.

Something like this? Microsoft Power BI

In the end, a model is just a bunch of data (see it as a table) and some geometry. That data, is technically not really different from any other industry. It is also just numbers, texts, true/false, dates, …

So, yes, with Power BI you can inspect 2 tables and search for changes, new rows, deleted rows or rows that are still entirely the same.

In this tutorial you can see that I performed 2 exports of the same model over time and set up a Power BI dashboard to verify what has changed:

Regarding:

You can solve this entirely with data without having to model more than a face or a simple solid. I will try to come up with a tutorial for that particular case. But in the end, if you have data coming from the model that states that there is an element with Volume X and Material M + you also have another dataset (Excel, csv, …) that states that Material M is actually made out of x percentage of physical material A, x percentage of B and x percentage of C, you can then let Power BI calculate how much you have of A, B and C by only modelling with M.

Further, you can create another dataset containing unit prices, stating that A cost x per m3, B something else, C also something else. If you then link in that dataset in Power BI you can immediately calculate what would be the cost of each element.

Power BI, even without 3DBI, is a powerful tool that everybody that is doing something with data (and BIM is all about data) could benefit from. Again, in the end, data is just number, texts and booleans, regardless of the industry you are in.

1 Like

Hi @kengey

Thanks for your further explanation of the extension.

Even if data is data, the thing for us here is how to retrieve it from a Sketchup model in an intuitive way, without having to model in an unintuitive way but also in a standard way.

If we use that slab example and convert volume to percentages, in order to return several quantities from a single volume, in theory that’s simple, however in reality that’s not sufficient. A layered slab is measured in area, if it would be completely flat, with a constant thickness it would be alright to have the area retrieved from it’s volume. Then, if we would have that area we could have the area for each layer and find a way to retrieve all those element’s costs or total quantities.

That is easy enough for a slab.

What about a F shaped wall? Would I also need to calculate area based on it’s volume?

It would be possible if all parts of that wall would have the same thickness, but what if they wouldn’t have? Would I have to find a formula for each wall of the project depending on their shape?

If your calculations are done by area, then add a “detection material” to a face in the Object and use the face area. 3DBI exports the area of each material that it detects on the faces of each Object.

The good news, with 3DBI you do not need to use Power BI (although meant for it), but you can also import all data in Excel, using Excel’s built in Data Connectors ( Import data from data sources (Power Query) - Microsoft Support => see JSON)

Here is a quick test model:

After exporting with 3DBI I get this .json file:

No worries, you do not have to actually read the json file as a human, let Excel do it for you:

After selecting the JSON file, you need to specify that it is actually a table and then you can expand the table:

Now, since you are interested in MaterialAreas, you will notice that these are defined as Lists.What you can do is expand all entries to new rows.
image

What this will do is that it will duplicate each row (representing the object) and replace the value of MaterialAreas with each value existing in the MaterialAreas list. If my model would have had 1 Object with 5 faces with a different material, the result would be 5 rows. Since my model only contains 1 material, it will yield only 1 row:

Here is a quick test with multiple objects with multiple faces given a different material:

And the resulting data in Excel:

Luckily I only had to press the Refresh button in Excel and did not have to go through all the previous steps of data modelling:
image

If I now put in 5 minutes more (after having spend these 5 minutes) I could also link to another Excel file, or Csv, or some other data source containing other information about the materials I have used.

Finally, the sharp eye will also have noticed that we do not only export material areas, but also lengths. So if you assign a material to an edge in an Object, the name of that material and its length will also become part of the exported data.

As a suggestion I would like to state: Do not put data in your models, threat your model as a regular data source (containing quantities) and use tools that are meant for data analysis to bring everything together.

Here are a few usecases:

  1. quantities + scheduling information (from msp) combined gives 4D: Microsoft Power BI
  2. quantities + cost (from excel) combined gives 5D: Microsoft Power BI
  3. quantities + retail information gives also some sort of 5D: Microsoft Power BI

And so are there much more use cases possible, all in the same software that Power BI is.

1 Like

OK. I could digest this.

Now imagine another example:

I have a “Paint” material in a wall. This wall has multiple layers:

  • Paint;
  • Plaster;
  • Brickwork.

I also have “Paint” material in a ceiling. The ceiling layers are:

  • Paint (which is the same material but more expensive);
  • Gypsum board;
  • Ceiling Structure;
  • Soundproofing

How can I use the same paint in different contexts?

  • Would I be able to retrieve the m2 of wall paint applied in the ceiling group and the m2 of wall paint assigned to the wall group?
  • Would I be able to read the amount of paint applied to geometry assigned to different tags of the model?
  • Would I have to paint a different Paint material for each surface that had a different layer composition?

Since each row also contains other info of each object (tags, definition name, instance name, every ifc parameter, and various other fields) you can combine that data and do a lookup based on that.

1 Like

Nice.

If I classify a model using IFC Classifications, will 3DBI read those classifications?